
Accurate year-over-year comparisons in Looker Studio
November 27, 2025
· Timmy Bontegard

Looker Studio’s default year-over-year comparison matches calendar dates. That can produce a poor comparison when sales, traffic, conversion rate, or ad performance varies by weekday.
For example, Thursday, November 27, 2025 would be compared with Wednesday, November 27, 2024. The dates align, but the trading days do not.
A retailer with strong Mondays and weak Sundays could end up comparing two days with very different buying patterns. Weekly reporting has the same problem: November 17–23, 2025 runs from Monday to Sunday, while November 17–23, 2024 runs from Sunday to Saturday.
A more useful setup matches records by ISO week number and weekday.
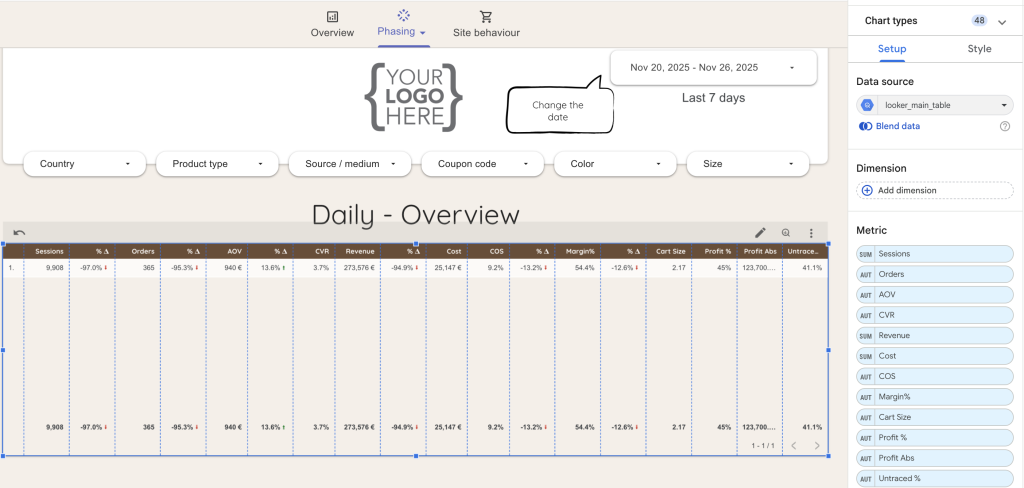
Build the KPI table
Start with a table containing the metrics used in your daily trading review.
For an ecommerce business, that may include:
- Sessions or users
- Conversion rate
- Average order value
- Revenue
- Marketing costs
- Margin and profit
- Orders missing from GA4 attribution
The exact metric set depends on the purpose of the dashboard. A finance view may prioritize net revenue and margin, while a marketing view may need spend, return on ad spend, and unattributed orders.
Create a weekday and ISO week dimension
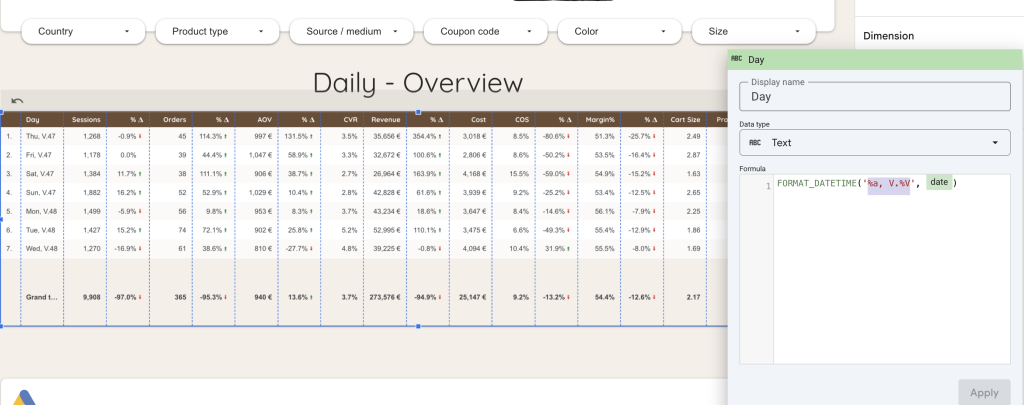
Instead of displaying the raw calendar date, create a calculated field that combines the abbreviated weekday with the ISO week number:
FORMAT_DATETIME("%a, V.%V", your_date_dimension)
Replace your_date_dimension with the date field from your data source.
The resulting labels look similar to:
Thu, V.48
Looker Studio can then align the comparison using the matching dimension value. A Thursday in ISO week 48 is matched with the Thursday in ISO week 48 from the comparison period.
Check the field type
FORMAT_DATETIME expects a Date & Time value. If your source field is typed as a Date, you may need the equivalent FORMAT_DATE expression instead. Confirm the field type in the Looker Studio data source before copying the formula.
Why the combined dimension works
Weekday alone is not specific enough. A comparison range contains many Mondays, Tuesdays, and Wednesdays.
ISO week alone also loses useful detail when reviewing daily performance. Combining the two creates a label for each weekday within a given reporting week.
Dimension | Example | Suitable use |
|---|---|---|
Calendar date | 2025-11-27 | Exact date reporting |
Weekday | Thu | Day-of-week patterns across a longer period |
ISO week | Week 48 | Weekly reporting |
Weekday and ISO week | Thu, V.48 | Daily year-over-year comparison |
Configure the comparison date range
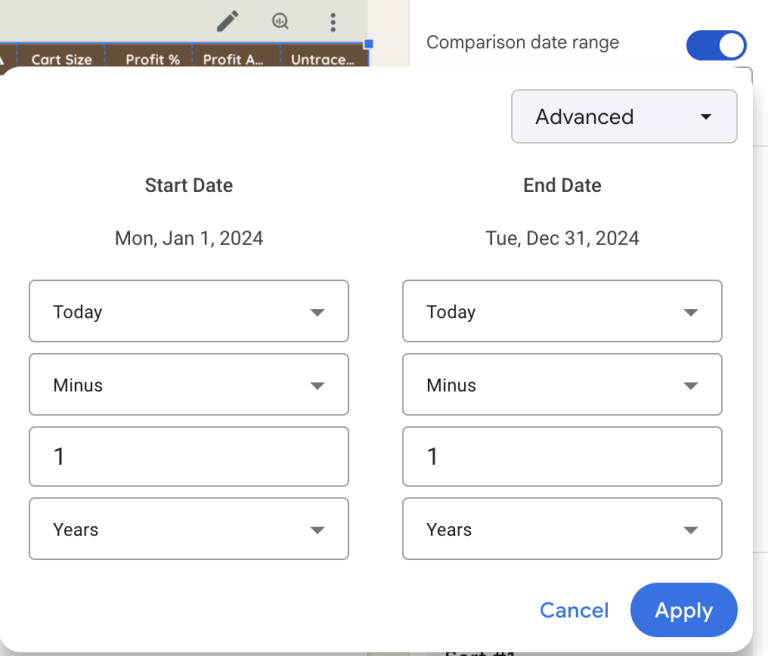
Select the table and open its Comparison date range settings.
The original setup uses an advanced comparison period shifted back by one year on both boundaries. The report’s main date range controls which current dates appear, while the calculated dimension identifies the corresponding weekday and ISO week in the prior-year comparison data.
After applying the comparison:
- Set the report to a short current period, such as the previous seven days.
- Confirm that each row represents the expected weekday and ISO week.
- Check several rows manually against the source data.
- Test a range around the start or end of the year, where ISO week numbering can cross calendar-year boundaries.
Validate year boundaries
ISO week 1 can begin in late December, and the final ISO week can extend into January. Add an ISO week-year field if your report spans those boundaries or includes multiple years in the same comparison dataset. This prevents identical week labels from different ISO years being grouped together.
Review the result
Once configured, the report can use a dynamic date range while keeping daily comparisons aligned by weekday and ISO week.
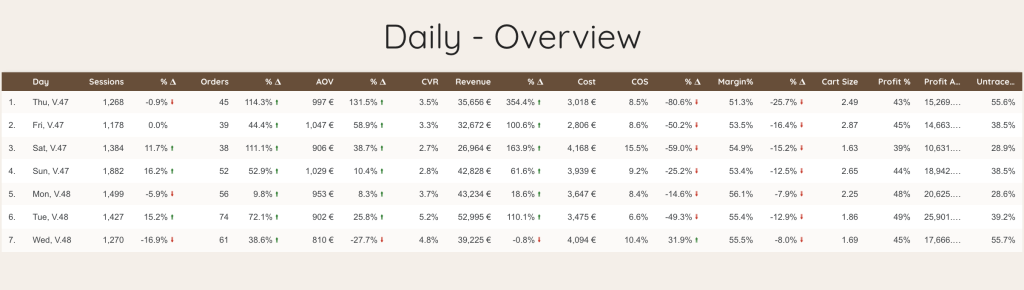
Before sharing the dashboard, compare a few values with the underlying ecommerce, advertising, or finance source. Date dimensions are easy to misconfigure when a connector supplies timestamps in a different timezone or uses an unexpected field type.
Apply the same method to weekly and monthly reporting
For a weekly table, format the date as an ISO week:
FORMAT_DATETIME("Week %V", your_date_dimension)
For monthly reporting, use:
MONTH(your_date_dimension)
Weekly labels may need an accompanying year field if the table can contain more than one year. A label such as Week 48 is only unique inside a defined year.
Monthly comparisons are less sensitive to weekday alignment, but calendar effects still matter. Easter, Black Friday, payday timing, and the number of weekend days can shift between months or years. Keep those effects in mind when investigating a large variance.
Practical checks before publishing
- Confirm that the dashboard and source systems use the same timezone.
- Check whether the business reports by calendar week, ISO week, or a custom retail calendar.
- Test weeks 1, 52, and 53 separately.
- Verify that partial current periods are compared with equivalent partial periods.
- Keep the raw date available for troubleshooting, even if it is hidden from the final table.
- Document the comparison logic in the dashboard so finance and marketing read the variance the same way.
Need help fixing a Looker Studio comparison?
Talk to us about your dashboard, data sources, and reporting calendar.