✦ Ondigital infinity → ✦ Perfect stitching → ✦ Insightful visualization
We turn raw data into a growth GPS
with our reporting-solution.
Your data is already trying to tell you something.
We create powerful reports that speak — clearly, visually, and fast.
Built for ecommerce brands who want answers, not guesses.
All your data in one place!
Our process - Measurable success ↓
1. Collect the Data
Connect your platforms to BigQuery and continuously collect all relevant data with our BigQuery Connectors.
1. Connect
We connect to your ecommerce platform, ad accounts, email systems, and ERP to automatically gather the data you need.
No manual exports. No connector chaos. Just complete coverage from day one.
2. Stitch it together
By stitching data across platforms, we unify fragmented sources into a single dataset that’s ready for analysis.
2. Stitch together
We match your marketing costs to your revenue — across channels, currencies, and markets.
This is where most tools fail. We’ve already built templates for common stacks, and our analysts make sure it fits your business perfectly.
3. Visualize
We visualize your data through interactive dashboards that enable the entire organization to see the same truth.
3. Visualize
We deliver dashboards that update fast, load instantly, and focus on what really matters:
KPI performance
Soft signals (e.g. brand, margin, discount impact)
Correlation between marketing & profit
Whether you use our ready-made templates or a custom setup, the result is the same: clarity you can act on.
➕ Optional Add-on: Strategic Insight
Let us run the insights with you — weekly, monthly, or ad hoc.
Sometimes the data tells the story. Sometimes, we translate it.
Collaboration
What working with us actually looks like.
We’ve removed the guesswork from setup, collaboration, and delivery. Here’s how we go from scattered data to decision-ready dashboards — usually in under 2 weeks.
- Dedicated analysts
- Full data coverage
- Customized for you
We learn about your business, your tech stack, and what insights you’re missing today.
If we’re not a good fit — we’ll tell you.
We connect your sources using Ondigital Infinity (BigQuery Connectors).
Most common ecommerce platforms are supported out of the box.
We apply a prebuilt model based on your stack and customize it for your needs:
True ROAS
COGS / margins
Multi-market attribution
Custom dimensions (bundles, discount impact, etc.)
You get fast, filterable dashboards that load in seconds.
We can either train your team — or help you interpret the insights with monthly or weekly check-ins.
"We’ve worked with Ondigital for our marketing, and one of the biggest value-adds has been their custom-built reporting tools. It has truly simplified our work — all relevant data is gathered in one place, making it easy to follow up, make adjustments, and quickly see results. We now have much better control over our costs and can easily track our goals and KPIs in real-time. Being able to oversee and optimize our various marketing channels in a structured, data-driven way has made a big difference for us. Ondigital is an excellent choice for companies that want to take control of their numbers, track their goals, and drive growth based on clear insights."

Louise Danell
Rawfoodshop ( 150M+ brand )
Our dashboards don’t just show numbers – they uncover opportunities
Explore real examples of the reports our clients rely on
-
Your KPIs
Overview -
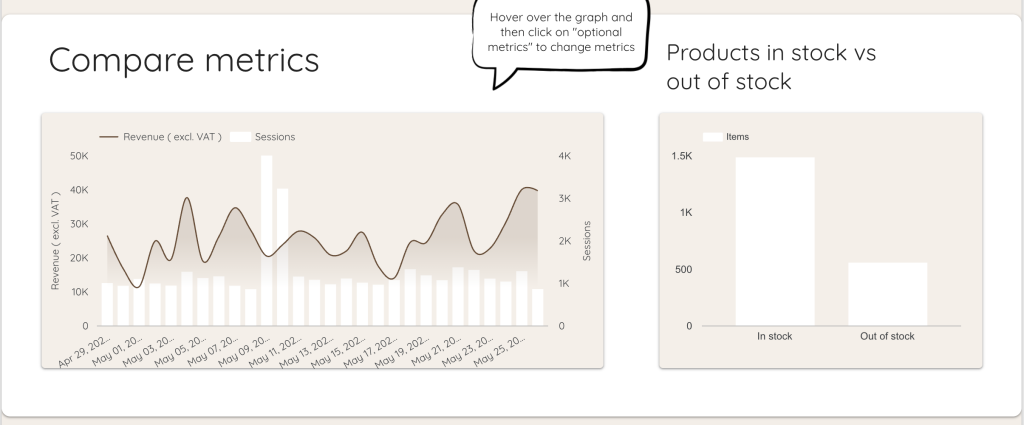
in a clear graph
Compare metrics -
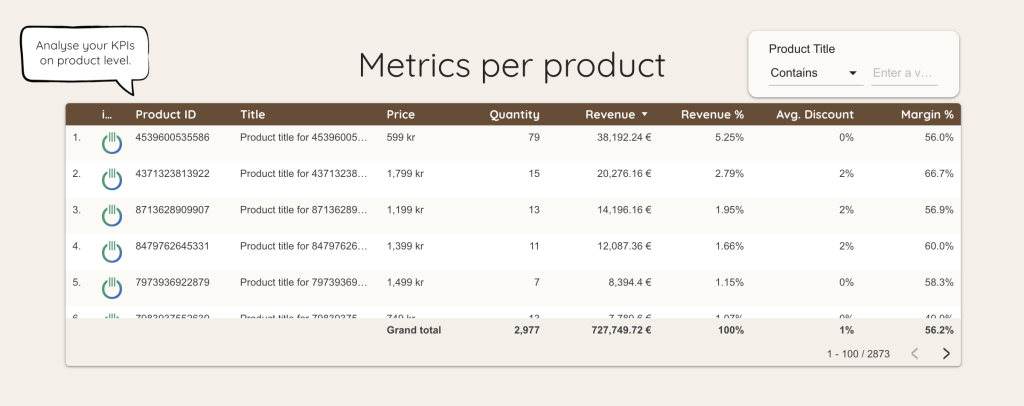
product-level data analysis
Metrics per product -
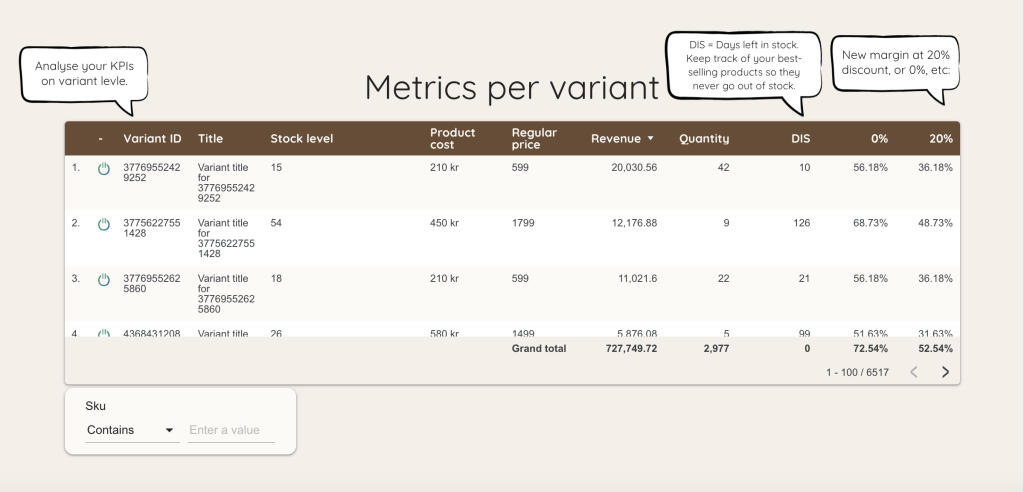
variant-level data analysis
Metrics per variant -
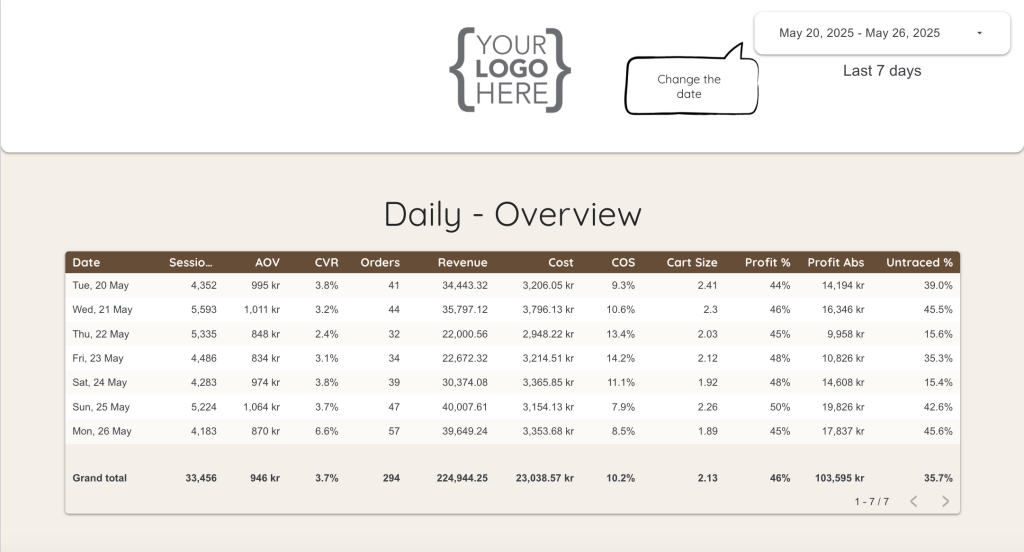
analyze daily performance
Daily Overview -
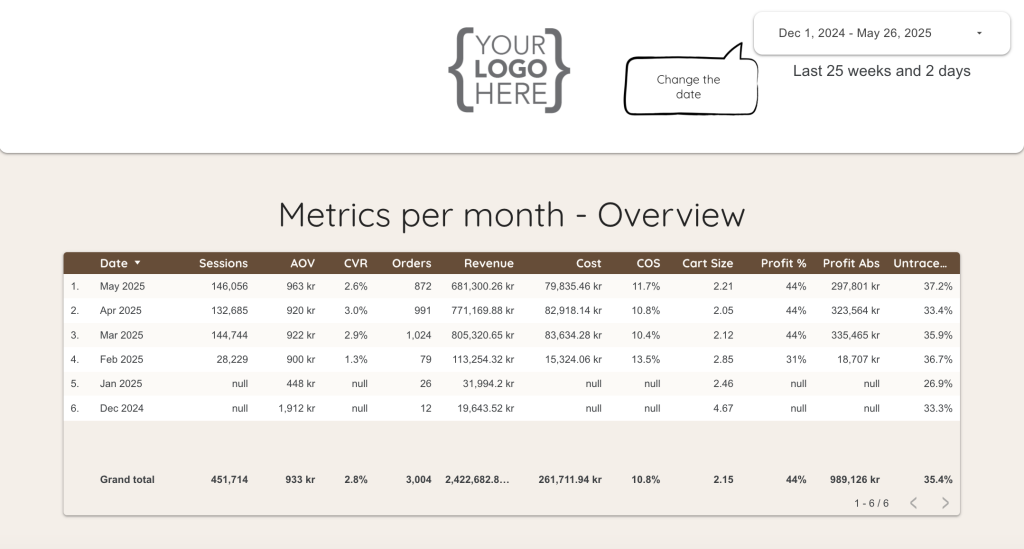
analyze monthly performance
Monthly Overview -
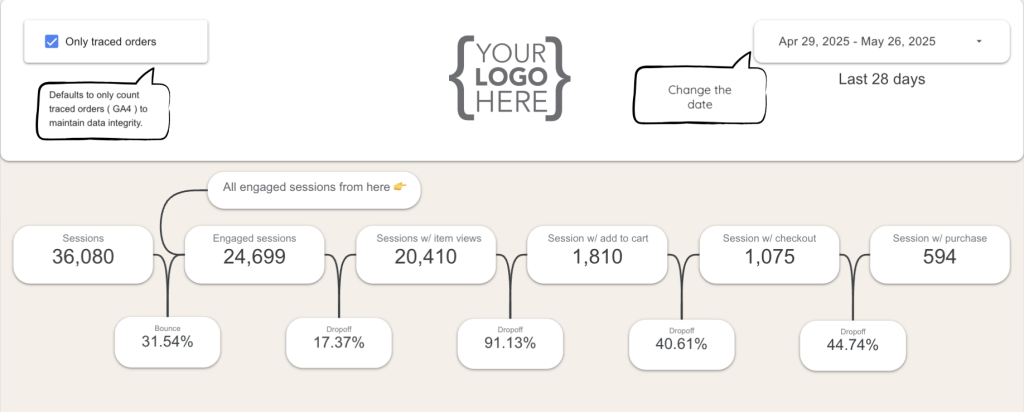
drop-off
Site behaviour
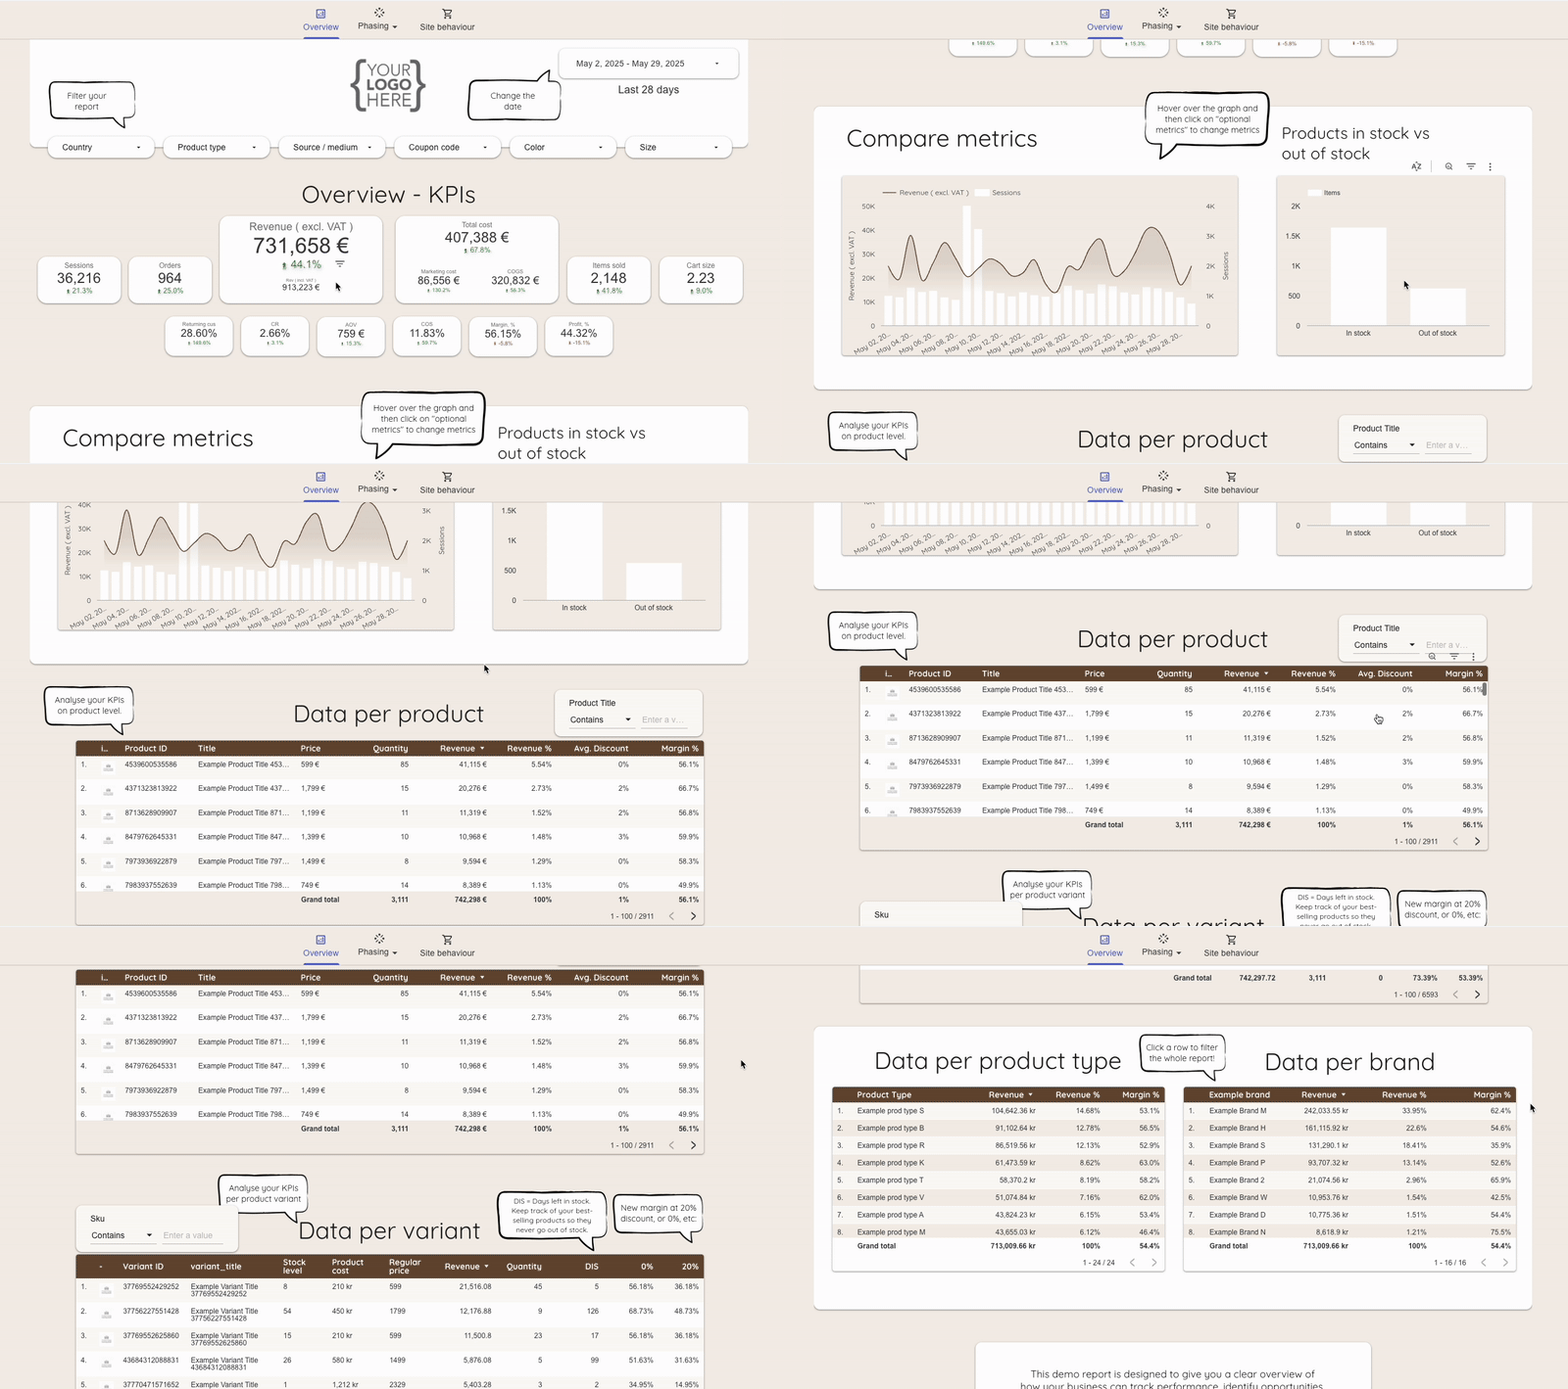
The Overview:
Get info on totals, per product / category / brand. Change date-range, filter the data on-demand.
Useful for:
– Getting an inital overview of the last 4 weeks
– Diving deeper into how certain products or categories affect the total
– Setting custom filters ( top X% of sales, stock levels, days left in stock and more ).
Read about how we contributed to Rawfoodshop's success through effective reporting
Rawfoodshop is a Malmö-based e-commerce company with its own brand in the grocery and organic products sector. The Rawfoodshop brand stands for sustainability, innovation, and natural values at reasonable prices. The company was established in Malmö over a decade ago and has since flourished, achieving an annual turnover of approximately 100.000.000 SEK. Additionally, Rawfoodshop and […]
Connectors
Do you want to build your report yourself but need to get the data in?
We create connectors, links between data sources and BigQuery or Google Looker Studio, so your company can visualize your data on your own.
Team Members
Meet our team of experts
With a passion for innovation and a dedication to excellence, we bring diverse expertise to every project we undertake.

Sofia Röstén
Paid Social & SEM Specialist

Sofia Röstén
Paid Social & SEM Specialist
- Email:sofia@ondigital.io

Timmy Bontegard
Developer & Analytics Specialist

Timmy Bontegard
Developer & Analytics Specialist
- Email:timmy@ondigital.io

Emmie Sjölander Holmgren
Digital Analytics & Marketing Specialist

Emmie Sjölander Holmgren
Digital Analytics & Marketing Specialist
- Email:emmie@ondigital.io

Qila
Chief Happiness Officer ( CHO )
FAQ
Got questions?
We have answers
We understand you might have queries. Here are some common ones we've addressed for you.
This depends on how much data needs to be stored in the database and how advanced the report you require is. We also offer package prices for those who want to collaborate with us on multiple levels. Connectors are from €5 per month. Contact us, and we will come up with a good solution together!
Connectors enable you to integrate data from various sources directly into Google Looker Studio, eliminating the need for manual data export and import processes. This automation saves time and reduces the risk of data errors, ensuring that your reports and dashboards are always based on the latest information.
Try our Looker Connectors here: Looker Connectors
We take a holistic approach to measuring the success of your digital marketing campaigns by looking at the overall impact on your company's growth. Instead of just focusing on individual channels, we analyze how each channel contributes to your business's bottom line. To do this, we utilize a comprehensive report that integrates data from your internal systems, allowing us to track key metrics. This approach ensures that we have a clear, data-driven understanding of how your marketing efforts are influencing your business's overall success.
We tailor our communication to fit your preferences, ensuring that you're comfortable and informed throughout the collaboration. Whether you prefer regular meetings, email updates or phone calls, we're flexible and ready to adapt to your needs. That said, we believe in maintaining close collaboration to ensure the project moves forward smoothly and aligns with your goals. By staying in frequent contact, we can quickly address any questions, provide updates, and make adjustments to keep everything on track.


